Fast Graphs for Slow Thinking N calculator.
SARDI Climate Applications & GRDC RiskWi$e
Use the V at the top right of mobile screen to access tabs including the information tab that explains inputs & graphs. 
This is a clunky prototype, but we are very interested in any feedback. Please send questions, critiques & comments to Peter.Hayman@sa.gov.au
The yield and starting soil N numbers apply to a single paddock or zone taking into account starting soil water, time of emergence etc.
If target decile {{B_Fert_D_aim:Text}}, will need about {{B_FertDkg:Text}}kg extra N/ha as fertiliser.
Assuming {{DrierMedPC:Text}}% chance of DRIER than median, the Long Term Average is about $ {{PWA_no_carryover:Text}} /ha with no carryover N and ${{PWA_Carryover:Text}}/ha with {{E_Carry_overPC:Text}}% carryover N.
This tab is designed to test the sensitivity of the Benefit Cost Ratio to the price of wheat, cost of urea and N fert recovery. Changing these numbers won't affect graphs or analysis on the other tabs.
Benefit Cost Ratio {{BCR:Text}}.
SHOWING WORKING for Benefit Cost Ratio = {{BCR:Text}}
Benefit =1t wheat @ ${{BC_Wheat:Text}}/t.
Cost = ${{BC_FertCst:Text}}
N fert applied for 1 t wheat = 20 kg N per t divided by efficiency
If efficiency is {{BC_effic:Text}}%, 1 t wheat requires {{kgN_t_wheat:Text}}kg N
1 kg N = ${{BC_Urea:Text}}/460 = ${{BC_NKgcost:Text}}
{{kgN_t_wheat:Text}} kg N = ${{BC_FertCst:Text}}
For more information on Fast Graphs for Slow Thinking applied to N P Hayman and B MudgeGRDC update paper 2024 and a Youtube Peter and Barry talk about N topdressing in 2023 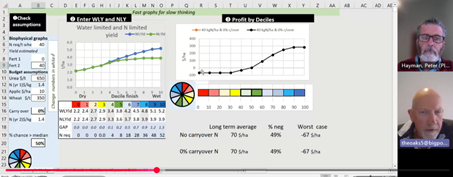
For excellent summary of N in RiskWi$e James Hunt on N in RiskWi$e at 2026 Perth GRDC update 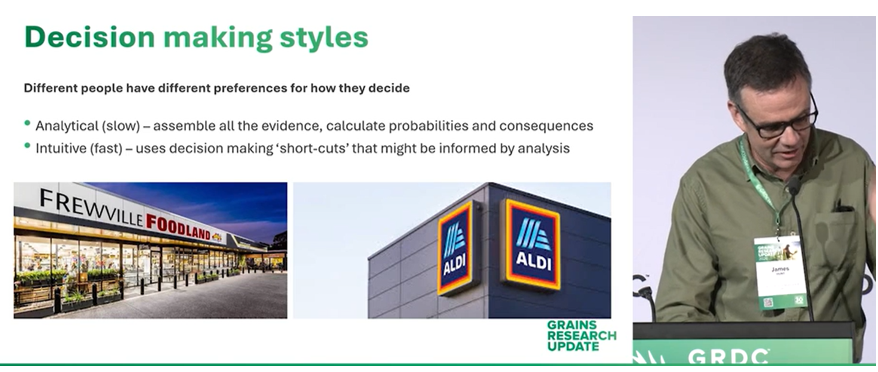
The idea of this Fast Graphs for Slow Thinking is to quickly develop a graph showing the upside and downside of adding N fertiliser along with the long- term average profit. Rather than doing the N budget for one target yield, this app calculates it for 100 target yields that are found by joining the line between the yield entered for deciles 1,3, 5 ,7 and 9. We have found that in most cases farmers and advisers are comfortable estimating this spread of yields for given paddock.
The input numbers are on sliders so that they can be easily adjusted to see how the graph of the upside and downside changes. 
Most of the terms below will be familiar to advisers and farmers who have been involved in N budgeting. These are defined for clarity
The 40kg rule: A tonne of wheat is about 20kg N/ha and at 50% efficiency, a tonne of wheat requires 40 kg of N.
N budgeting: Convert a target yield to N demand then subtract N in soil to get N fertiliser requirement [3t/ha = 3 x 40 =120kgN/ha, If soil N = 80kgN/ha, then require 40 kgN/ha as fertiliser].
N budgeting across deciles. Rather than picking a single target yield, estimate the water limited and nitrogen limited yield for deciles 1,3,5,7 and 9.
Water Limited Yield WLY across deciles. For the given paddock, taking into account the starting soil water and time of season break, what would the yield be in a really good year (decile 9), a poor year (D1) an average year (D5) and below and above average (D3 and D5).
Nitrogen Limited Yield NLY. This requires an estimate of starting soil N (kg N/ha) which might include starter fertiliser. In crop mineralisation can be hard to estimate, but a starting number is 15kgN/ha in D1 and 30kgN/ha in D9.
Fertiliser Limited Yield FLY. This is the yield limited by fertiliser; it is essentially the new nitrogen limited yield. In this app the value is determined by aiming for decile.Profit X Decile graph is a graph that shows the upside and downside of the user defined rate of N fertiliser based on the biophysical assumptions.
Long term average profit takes into account 100 possible outcomes and includes each of the losses in the bad years and gains in the good years
Carryover N%: If 40kg N/ha are added with the hope of an extra 1t/ha and the season turns out drier and only 20kg/ha was needed for 0.5t/ha, cost of the unused 20kg of N is written off as a loss if carryover is zero and valued at 10kg of N if carryover is 50%. The unused N is valued as a saving in N fertiliser in subsequent years.
Percent chance of being DRIER than median. At 50% this is the same as long term climate odds. After looking at forecasts and listening to experts, a user can adjust this to see how it changes the shape of the profit by decile curve and the value of the Long-Term Average Profit.
Benefit Cost Ratio for N on wheat depends on the cost of N, the price of wheat and the efficiency. This is a simple calculator that enables a user to change the numbers. Note changing these sliders will not change the numbers entered in the other tabs.